Hello and welcome to this quick review of Zcode’s Top automated Systems and our Results that we’d like to share with you guys! As you may well know, our Z-Lab Development team is constantly innovating and improving our zcode systems, so it’s no surprise that a LOT of NEW features & sytems have been added over the years. With over 250+ automated systems, it’s easy to get overwhelmed fast and lose yourself in the myriad trends that we have to offer. That’s why we created this automated system ratings list that we call Zcode Top Systems! This list contains all our BEST and active automated systems that generate picks & predictions across VARIOUS sports, and makes it so much easier for you to follow THE most effective & profitable ones.
But before we get into the Top Systems list, I’d like to show you our Top Systems Results page
which gives you a neatly summarized table of the cumulative profits from all of our best systems, over the years. So, open your browser and go to http://zcodesystem.com/results 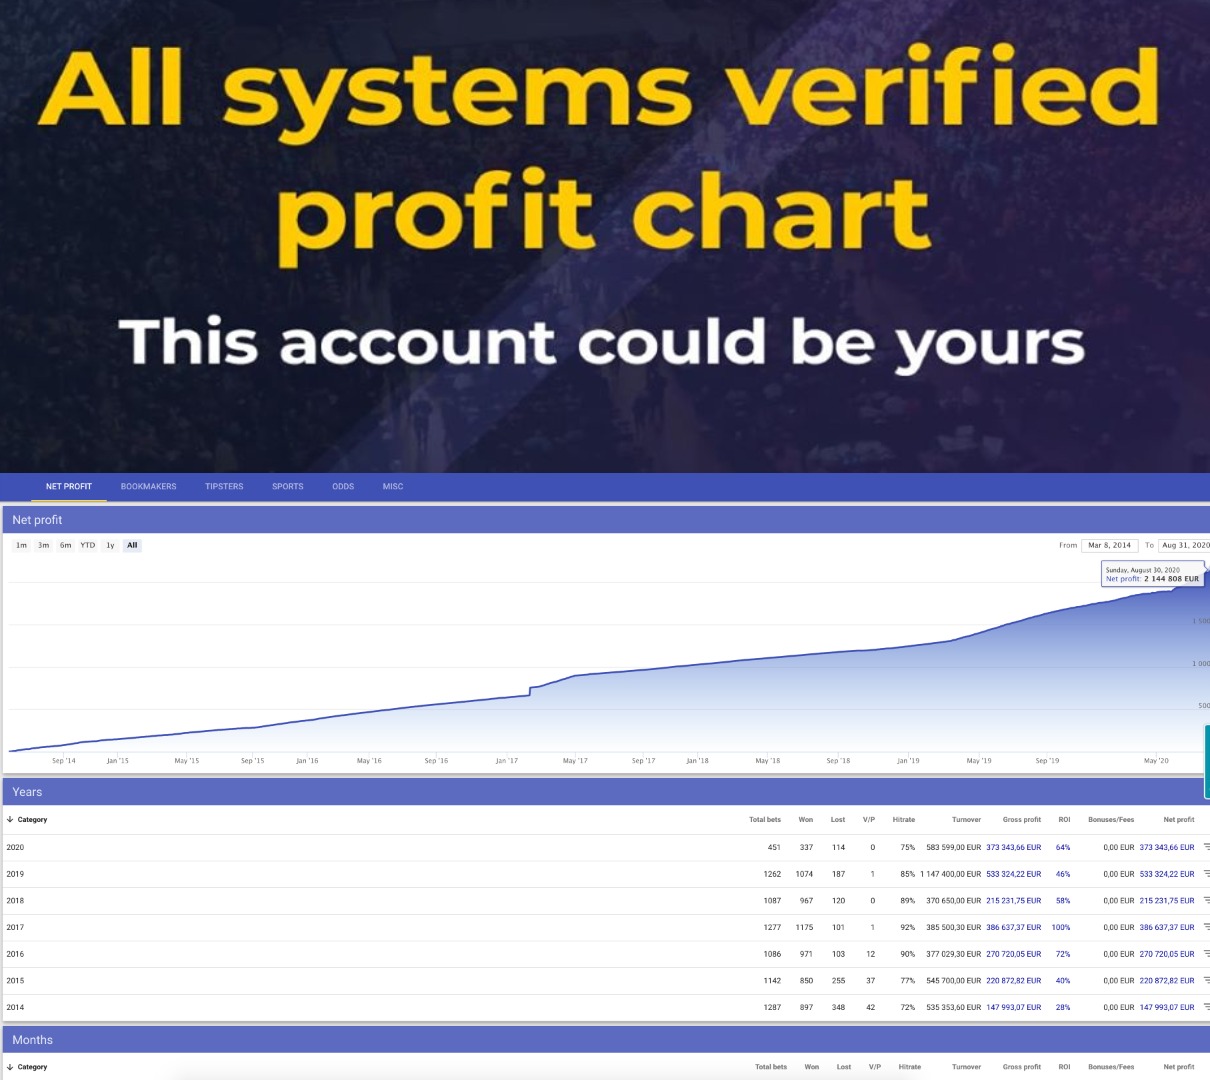 If you’ve ever wondered how our Zcode systems have been faring on a monthly basis YEAR after year, look no further than this Results page! The following table shows the past performance of all our automated systems combined and it gives you a detailed breakdown of the results achieved, month by month over the past 14 YEARS, i.e., starting all the way back from 2007. The results are totally transparent and 3rd-party verified.
Of course the past performance does not guarantee future success, but this will give you an idea what you could make if you followed these systems and winning picks consistently.
Now if you were to hover your mouse over the table, you will notice this pop-up..
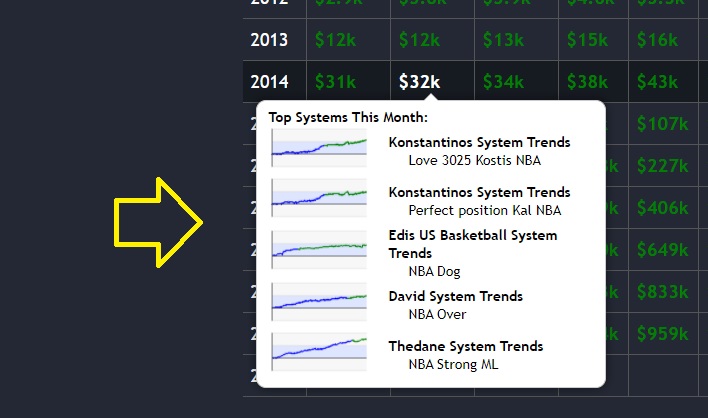 and each cell will show you the Top 5 MOST Profitable systems for THAT month
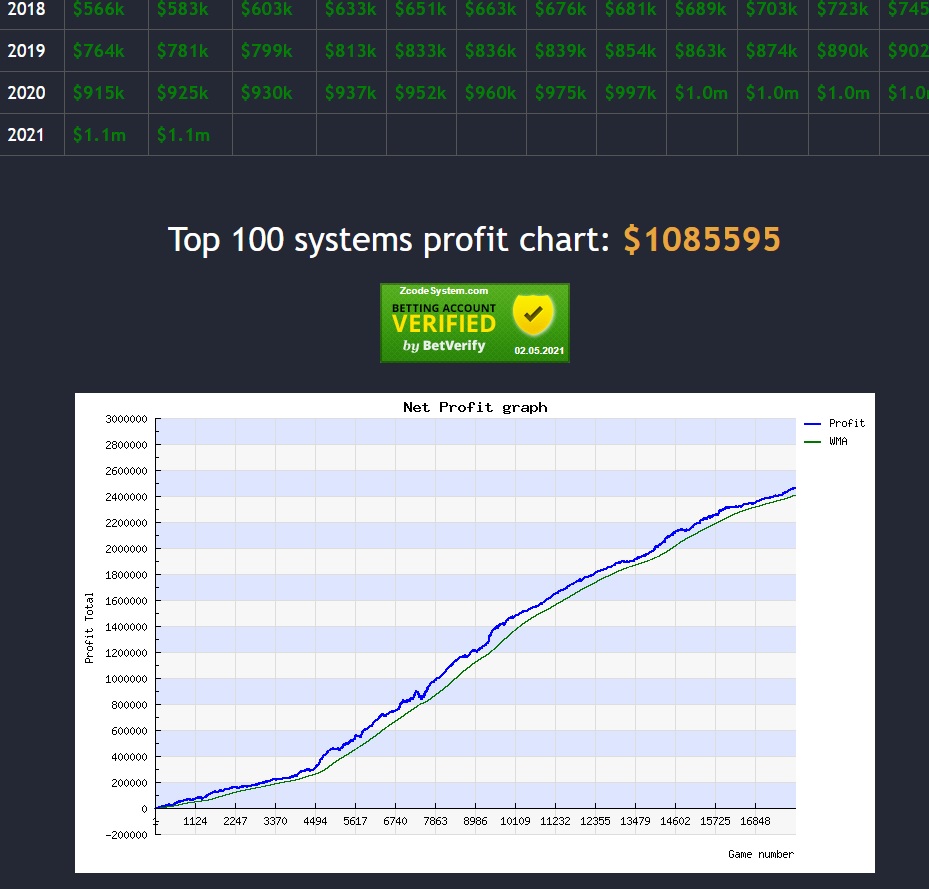
Let’s take a look at the most recent results, here in Feb 2021..
we’ve already reached a running profit of $1 MILLION dollars in total, with an average stake of $100 per unit.
So as you can see, you can go through the results for each month here and also keep in mind the best systems that contributed to the PROFITS for the month.
TOP SYSTEMS
To make things even more convenient, Right below this table, you will find the complete list of all the Top Systems included on the very same Results page. This is the same list you will find on our dedicated Top Systems page as well, although this one is limited to the top 100 only.. while you can find a much more exhaustive list inside the Members Area.
We ALWAYS recommend our Zcode members to pay attention to the Top Systems list, especially for newbies who are just starting out with Zcode.. because THIS is the easiest way for you to gain access to THE most profitable systems that we have to offer here at Zcode, all on one page.
http://zcodesystem.com/results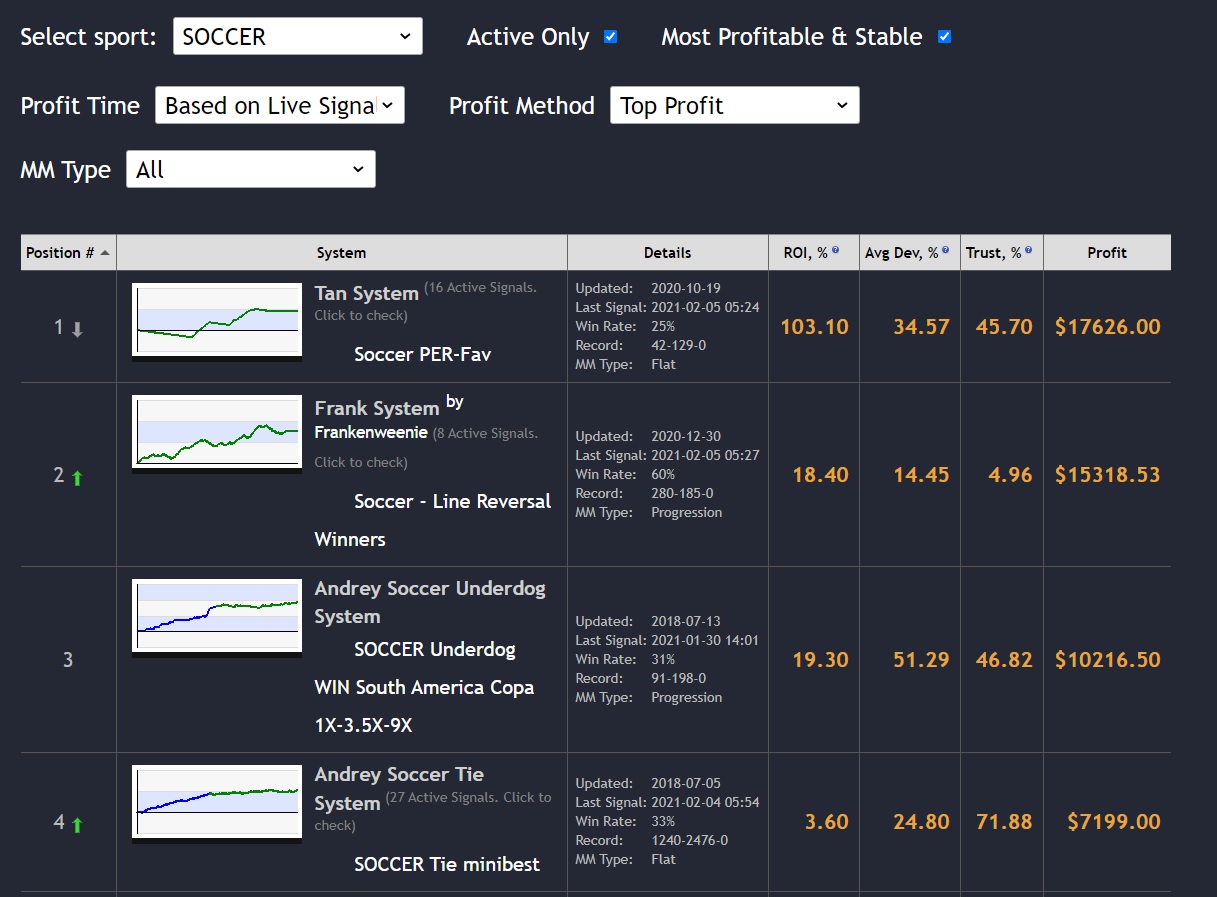
Now if you’ve been WONDERING, which Automated system is performing better or what to follow? Here, you see a complete list of all the Top automated Systems available to you, sorted according to their PROFITability or Performance in terms of profit amount. The following Top Automated Systems RATING is based on our proprietary Power Rankings, which is an advanced formula that calculates a system’s position based on its recent 3 month performance. This will help followers to quickly decide which system and trends are HOT right now and which to follow.
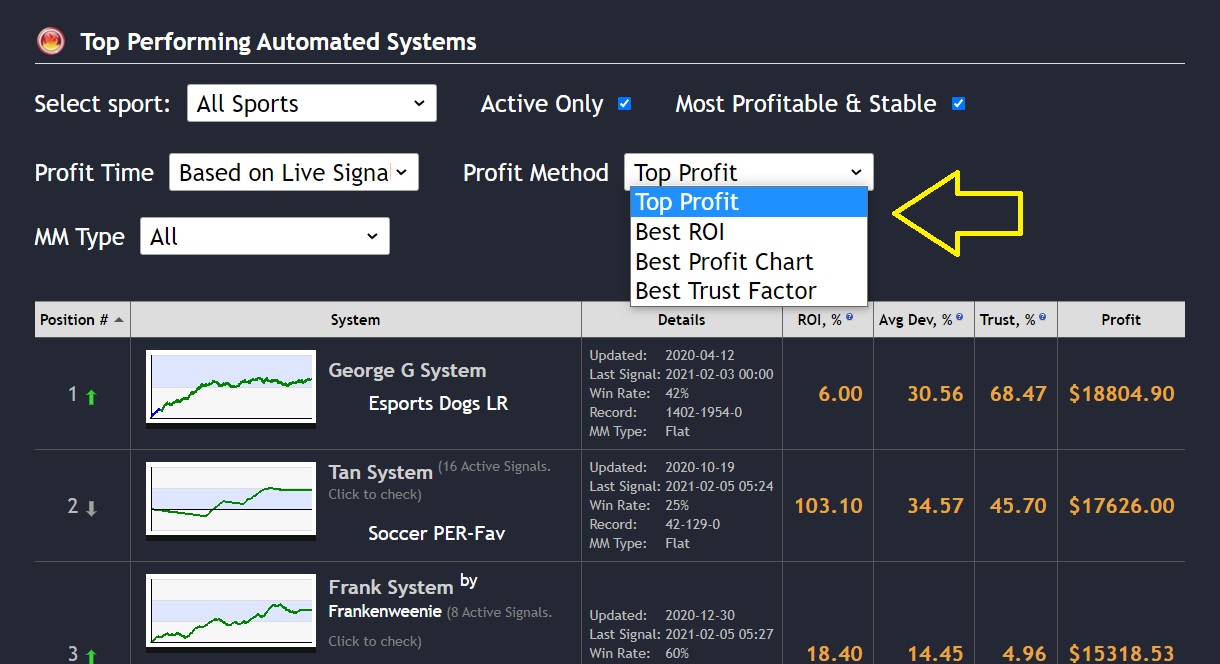
And Right at the top of this Top Systems list, you’ll notice these Filters and related Dropdowns with various options..
What we definitely want to focus on first is: HOW to use these filters in order to select systems and sort your list in the most effective manner, so that you can start to follow the most profitable systems right off the bat!
Filters: You can filter the available systems according to the SPORTS you prefer. Take at look at this exhaustive list of Sports you can choose from.
Then, you can further filter the list of Top Systems by restricting them to current ACTIVE ones…
OR the Most PROFITABLE & Stable systems…
OR you could even combine the two conditions to be highly selective.
We leave these options upto you because what you choose to go with will depend on what YOUR PERSONAL betting style is, as well as your risk appetite!
You can also choose the TIME PERIOD over which the system’s profitability is measured.. as you can see here, last 3 Active months, Last 3 months,
since the beginning, i.e., from the inception of this system
OR you could also restrict to only this year’s seasons..
plus, you can select a specific year over the past DECADE.
Now, when it comes to the Profit Methods, you have 4 main parameters or CRITERIA to choose from.. let’s click this dropdown and take a look here: you’ve got Top Profit, Best ROI, Best Profit Chart and the Best Trust Factor…
And each of these options are related to the Statistical Columns over here to the right…
 Let me explain each of these one by one:
Top Profit is quite self-explanatory really.. it shows you the total profit generated by this specific system trend over THIS Profit Time Period that we chose.. assuming that unit stake size is $100. So, as we see for the current top system, which is Tan/Soccer AntiPublic System, it shows a Total profit of $48,853 .. based on LIVE signals alone.
The next factor is the Best ROI or Return on Investment. This is a value that tells you how profitable or efficient the system’s Profitability is in comparison to the cost of investment. This is a standard and rather popular measure used for investments, so it should be commonly known to most of you in any case. It basically gives you a theoretical figure of how much you could expect in RETURN for investing in a particular system.
Now the Best Profit Chart is related to this column here
Average Deviation% is a statistical criterion which shows how much the real Profit values DEVIATE from the expected values for a specific system. In other words, it measures the irregularities in the system’s performance compared to its expected predictions.. and as such, it is directly related to the SMOOTHNESS of the system’s performance graph. Which is why THIS is related to the BEST PROFIT CHART option here.
The higher the value, the more irregularities and bumps you’ll see in the system graph.. so the lower the value, the smoother the graph and hence, more desirable (unless you dont mind being on a profit roller-coaster, haha!)
Finally, the Trust Factor is a new parameter that WE developed here at Zcode, to help us measure the realistic effectiveness of a system when forward-tested in the real world in comparison to its backtest results over historical data The closer a system’s forward-test results match its backtests, the more we can TRUST such a system, however that doesnt necessarily mean it will have the highest Profit return.
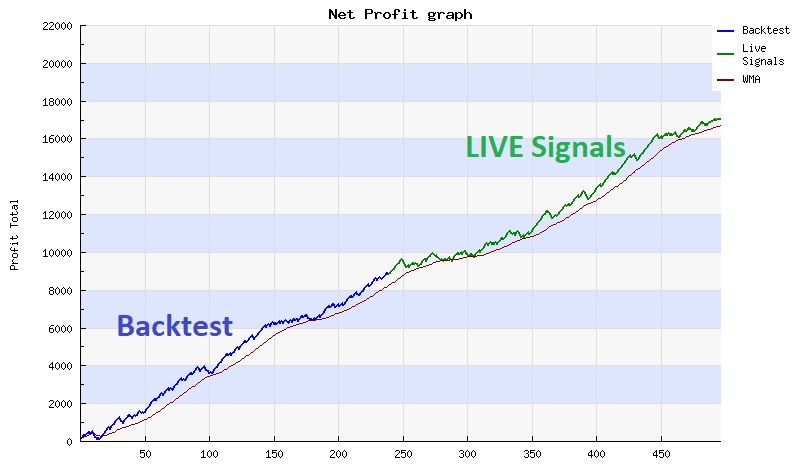
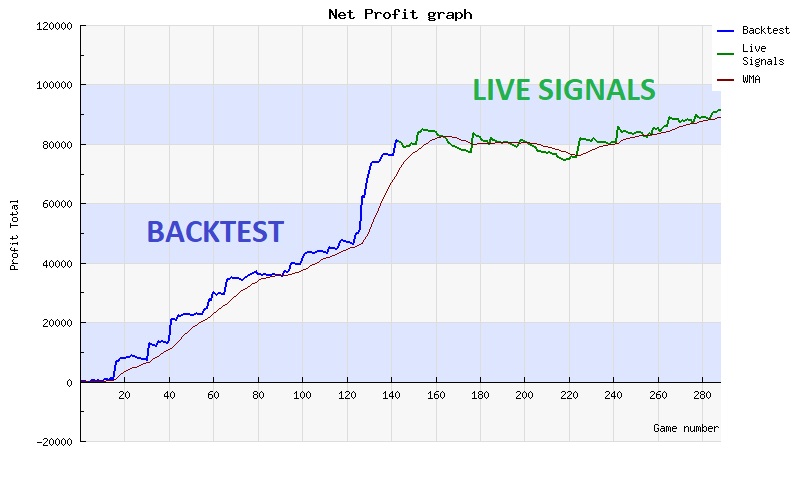
Look for systems that stay profitable after backtest – here is an example of a good system:
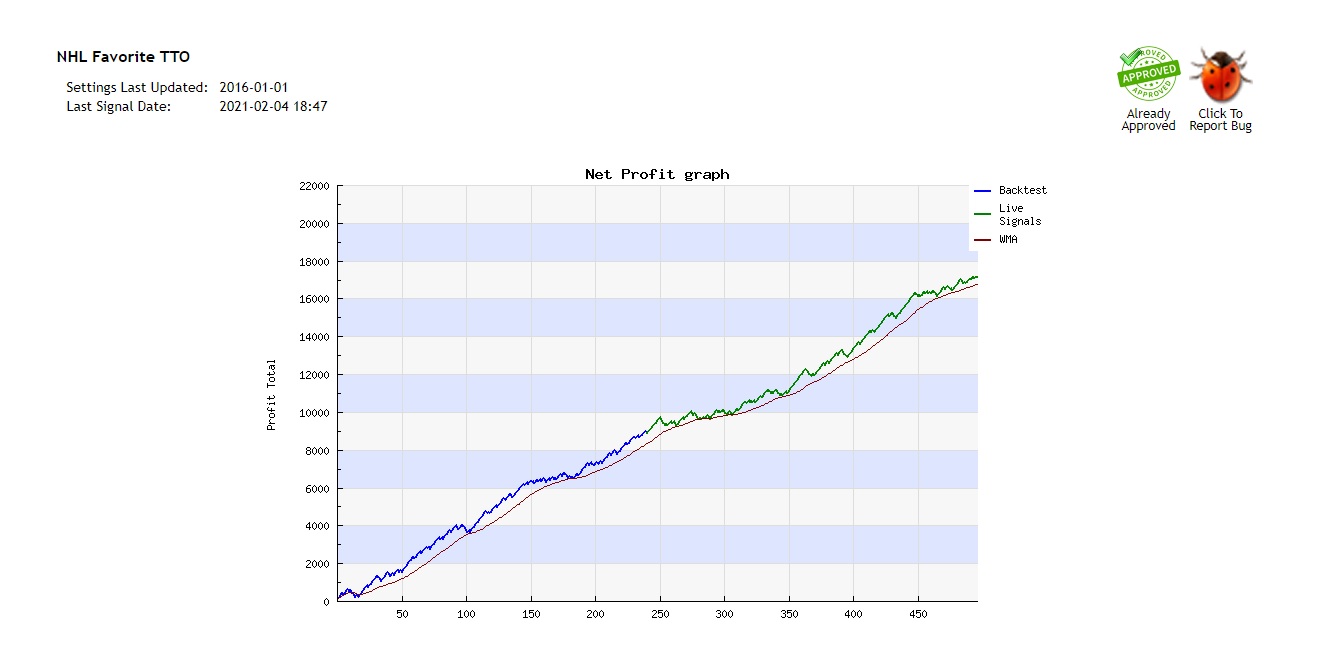
 And now here is an example of a bad system which was over-optimized (Curve-fitting issue) and could not perform as good on live signals compared to backtest:
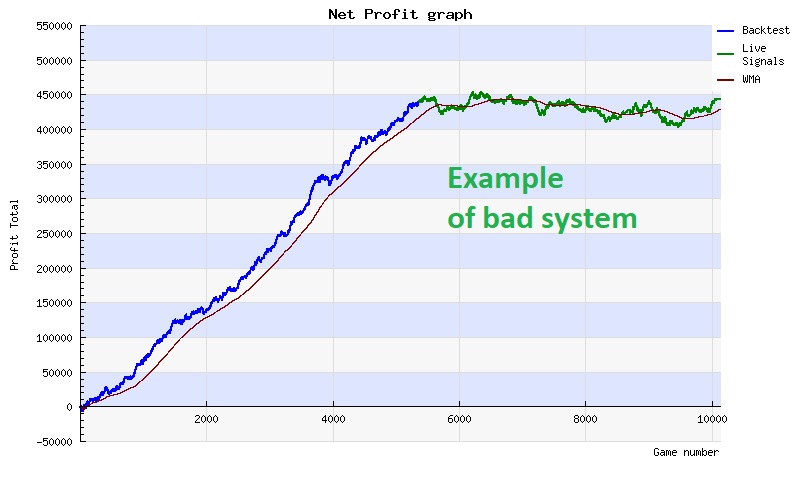
It usually happens when the developer of the system set too strict filters that are based on specific performance of a specific team (for example say Yankeed played great on Sundays last season so the creator of the curve-fitting systems excluded Yankees games on all other days making a nice historical chart while the trend did not hold the next season when Yankees roaster changed and they stopped playing well on Sundays)
PRO Tip – Avoid systems with curve-fitting and try to paper bet each system to see how stable the forward test results are before betting real money.
Finally, after the Profit Type filter, we have the MM Type, which means Money Management. This allow you to filter out systems that use flat staking versus a progressive style of staking. Progressive staking is good for loss recovery but it can be riskier. In this case, we’re just going to leave it at ALL, which is the default
And right below all the filters, we have the ACTUAL table containing the list of our Top automated systems… and it provides you with tons of information regarding the Profitability and Reliability of each system listed here! So, right off the bat, you can see the top systems listed in DESCENDING order of the Profit Method, which is the Top Profit by default.
You have the Position# of the system, which of course will vary from time to time depending on the profitability of these systems.
Then we have the NAME of the system and the name of this specific WINNING Trend just below that 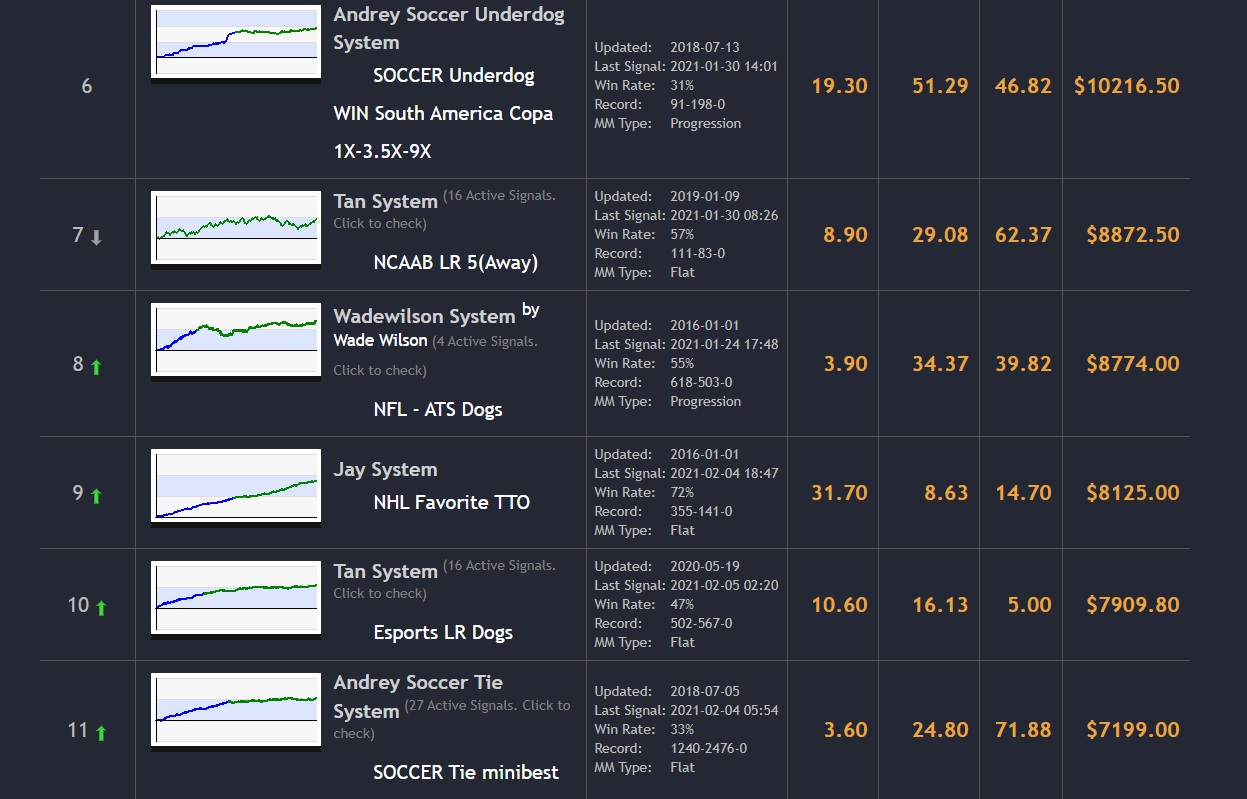
and the System GRAPH, which gives you a visual idea of how well the system is faring, based on the Profit Time we’ve selected HERE
Now the one thing that’s relatively new in these System graphs is the way the equity or profit curve is split into this BLUE segment here, which indicates the historically backtested section of the system’s published results
VERSUS the rest of the GREEN segment which indicates the actual FORWARD-TESTED section of the system’s results.. which means that this gives you an idea of how well it has fared in terms of it’s LIVE real-world results.
Now ideally, we would want to have a balance between the backtested and live rsults of the system. For example, if you have a system where there is more of the BLUE line versus the green.. that means that the system has been backtested very well and displays great results over past historical data, but it has yet to show how well it performs in its real-world results.
Next up, we have this detailed column called, well, DETAILS, hehe.. You notice it says Updated here, Last Signal generated, the Win Rate%, Record so far and the MM type.
One thing I must clarify immediately is that this Updated date is NOT the date on which the system’s latest results were updated.. rather it is the last time when the RULES of the trend were modified & updated by the system Creator. So do not get that confused.
Last Signal is rather self-explanatory.. that’s the date & time at which the most recent signal was generated by this system trend.
Win Rate% is a simple value that indicates the percentage of Wins out of all the Signals generated by the system so far, across this Period of Time
Record is simply displayed in the standard format of the number of Wins.. followed by the Losses and finally, Ties or Draws
So, if you were to think about it, the Win Rate% is calculated by taking the number of WINS here, divided by the SUM of all these numbers.
And finally you have the MM type, or Money Management, which we discussed earlier.. in this case, the system staking is simply FLAT.. that means, we used fixed stakes with NO progressions.
The systems with progression (i.e. ABC progression or other) can generate much more profit compared to flat betting but also involve more risk and require higher bankroll to handle those big C bets.
Oh, by the way.. each of these details here can be SORTED in ascending or descending order.. all you need to do is click the detail you wish to sort by.. for example, let’s just try out, WIN RATE%
Click this and it sorts the whole table in order… and then if you click it again, it’ll sort the entire list again in the opposite direction. So this can be done for the other details as well.
Now, the next 4 columns are related to the same Profit Method filter options as I mentioned earlier, so I’m not gonna explain them further. But if you ever get confused about the definitions for each of these columns, just hover your mouse over this question mark sign and it’ll give you pop-up that explains the parameter in DETAIL!
So as you can see, this table gives you a great deal of info & a quick summary of how profitable and efficient each system is. Oh and By the way, just like how you can sort by these details.. EACH of these individual columns is also sortable as well!
So if you simply click the header, the entire table will be sorted, based on the value of that particular factor or parameter, IN ascending or descending order
(which you can figure out from the way this arrow points up or downwards)
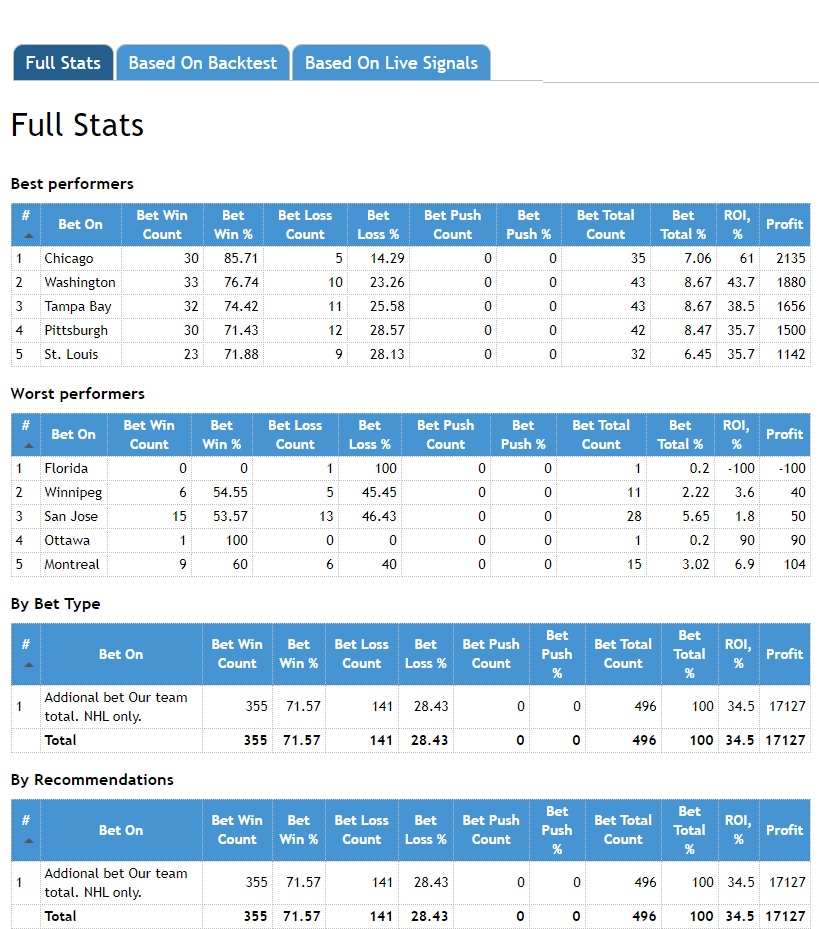
Stats of the specific system or trend?
Now, for those of you who love statistics, our Zcode Systems are a GOLDMINE of stats and figures! If you want to know more about a system and its trends in detail, just click on the name of a system on this list, and you can easily access its page with all its trends’ statistics, signals and backtests.
You can get a detailed backtest of the system by clicking on the System name and then by selecting one or ALL of its trends… and its performance results come complete with its graphs and tabulated results for each and every pick generated by this system and its trends.
The first thing you’ll notice at the top is that it says this system page will auto-update every 5 mins, so there’s no need to refresh the page. And depending on whether there are any new signals available, you will see a notification for that displayed here. If you were accessing this system within our Sports Trader app, you will also receive PUSH notifications for any new signals generated by the system. Right now, there arent any new signals for the day, so let’s move on..
The next thing you’ll notice is the highly detailed STATISTICS provided for each system..
and remember, every System can have MANY more sub-Trends, which you can see here when you click this button right next to ‘Active Signals’
ALL these sub Trends are contained within this single system alone, and if you wanna know what each of them means, it’s best to follow the Experts thread on the forum. But let’s just say that you’re not picky about the trends, and you want all of them in order to generate the maximum profit possible. So let’s leave that as it is..
Let’s scroll down further.. and you’ll see all these highly detailed tables and graphs for this system!
Now, we arent going to cover ALL these trends and their stats in minuuute detail here, because this was already covered quite well in a previous video, which you can find on the Tutorials page or even on our youtube channel.
So, if you’re a sports statistic junkie, you’re gonna LOVE the amount of detailed statistics and data we’ve provided you here. And remember, the Power Rating behind our ratings list is fully automated and has no human bias here!
Alright guys, so that’s what I wanted to show you, on our TOP Systems RESULTS page. Now besides this list, I also want to give you a quick look at our Top Experts page, which is a list of all our best & brightest experts, many of whom are the creators responsible for some of the best profitable systems that I already showed you.
All these Experts started off as Zcode members themselves and are proficient in betting across various sports. Many of them have been betting for a long time and over the YEARS, some of them have developed their own systems and styles of betting. Many of them also use the Z-Lab tools that we provide our members within the VIP Club to develop their own automated system trends and also fine-tune them along the way.
Once you become a member, you will be able to receive signals from these Experts. Most of them also post their manual or personal system-generated picks on the Wall, as well as on the Forums.
And the best part is, if you wish to follow ANY of these Experts, all you need to do is click this FOLLOW button here.. and you will start to receive push notifications every time your selected expect sends in a new update or signal alert.
So, as you can see, at Zcode.. we give you the flexibility to follow not only a vast range of Top automated Systems, but also manually follow our amazing Top Experts as well :))
SPORTS TRADER 2.0 – BRAND NEW VERSION
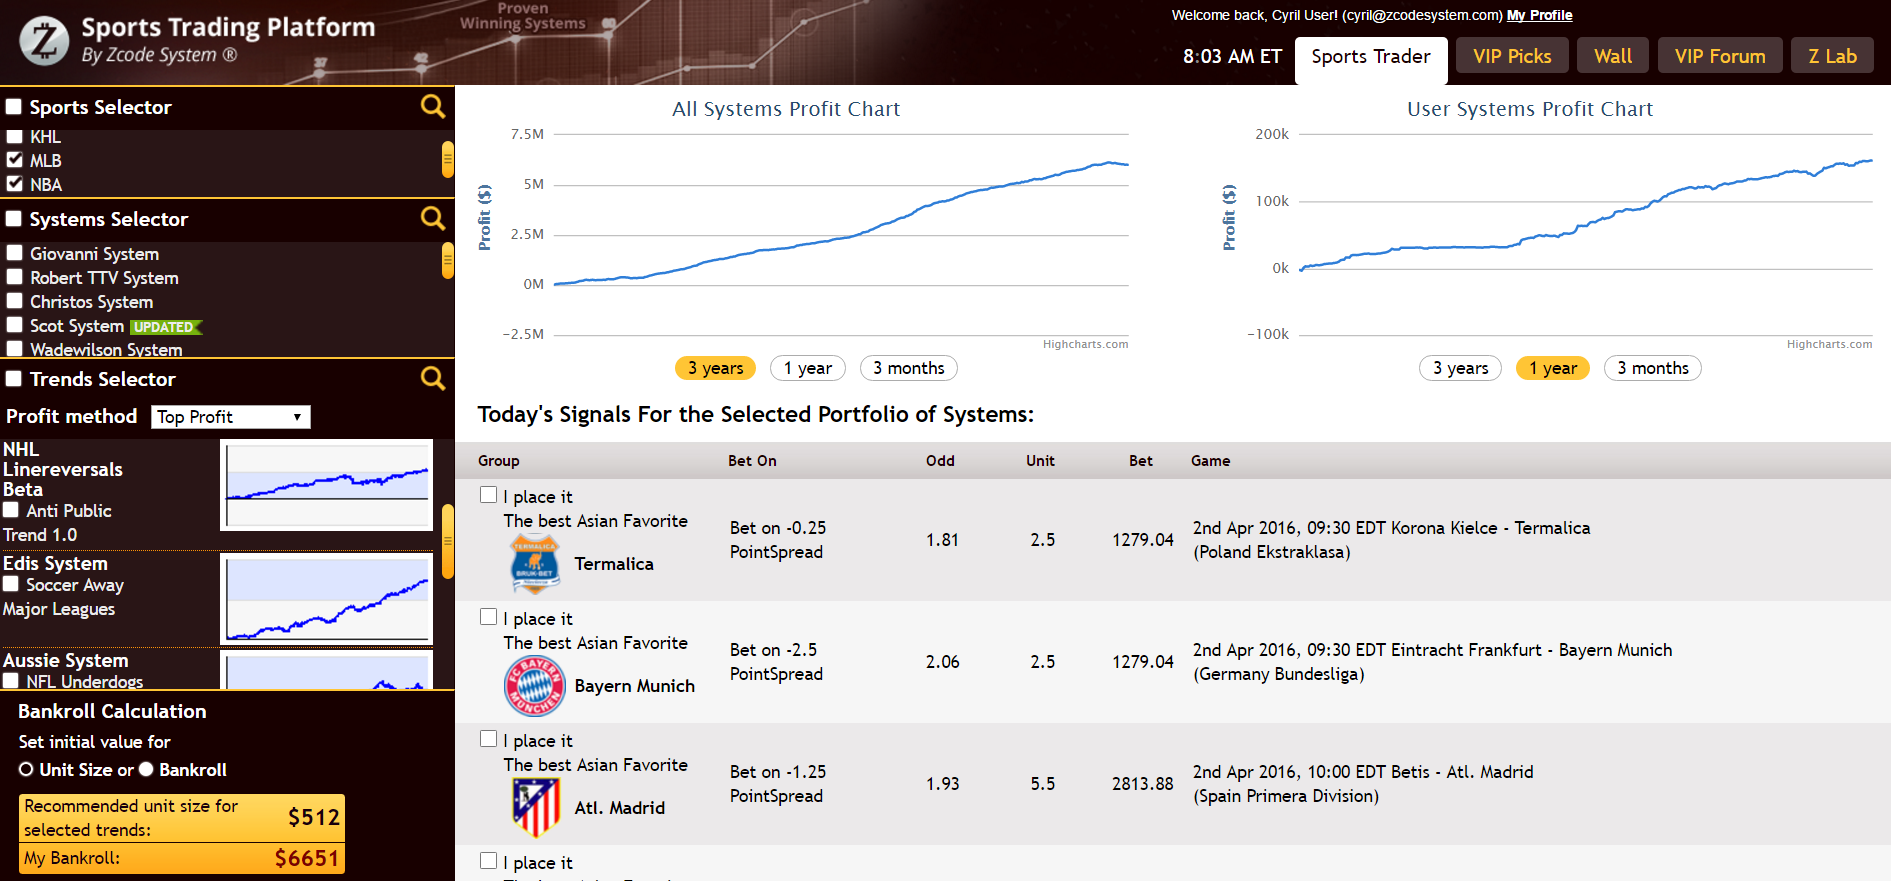
Alright and finally, LAST but not the least, is our famous Sports Trader software, which is available as a subscription or upgrade package for our existing members. You can access it either as a web-based app from within our VIP CLub.. which is what you are seeing here..
OR, you could also run the Sports Trader app as a standalone software on your system or laptop, it supports Windows, Mac and Linux!
We actually developed this software a few years ago in order to help our members to streamline their betting process. Considering the fact that we have more than 250+ systems and more than 5000+ trends overall, it can sometimes get a bit overwhelming, especially if you’re a newbie or if you havent yet developed a disciplined apprach to betting with our systems. And that’s where Sports Trader comes in!
This app helps you to simplify the process of selecting the best systems & trends that you’d like to follow and then organize them into PORTFOLIOS, which you can easily load up and then follow through the app’s settings. Each portfolio you create can also generate a unique set of SIGNALS for you to follow, depending on the sports and the system trends you’ve added to the portfolio. And the best part is, Sports Trader also comes built-in with a Portfolio Advisor, which can help you to create a PROFITABLE portfolio right from scratch!
It also comes with a Portfolio Analyser AND a Stake Calculator, all of which you will help you to further tweak and improve your portfolio of systems, as you get accustomed to working with this app.
We have covered the entire Sports Trader software in EXCRUCIATING detail in another series of tutorial videos, which you will find within our Members Area.
So WHAT are you waiting for! Just go straight to this link and sign up for your copy of Sports Trader NOW!
Get Sports Trader it here:
https://zcodesystem.com/sports_trader_zcoders/
So yeahh guys, that’s about it.. this is what I wanted to show you.. with what awaits you on the Top Systems & Experts pages, as well as Sports Trader. With this vast amount of detailed info from our top listed systems, there’s nothing to stop you from achieving best RESULTS in sports betting with us, here at Zcode.
That’s all for now, guys. Thank you for your time and we hope to see you inside our Zcode VIP Club soon!
Take care and bye for now!
P.S. Upgrade to Zcode VIP Club and Unlock All Winning Picks. Instant Access.